

Demand Planner — Plan demand, production and stock
Client: scale.ag
Plan demand, production and stock in one place
Demand Planner converts sales history into statistical forecasts, net production requirements, and a clear weekly production schedule. It is designed for SMEs that still juggle Excel files, emails, and last-minute decisions.
Use cases: demand forecasting, production requirement calculation, client-priority allocation, PDF export.
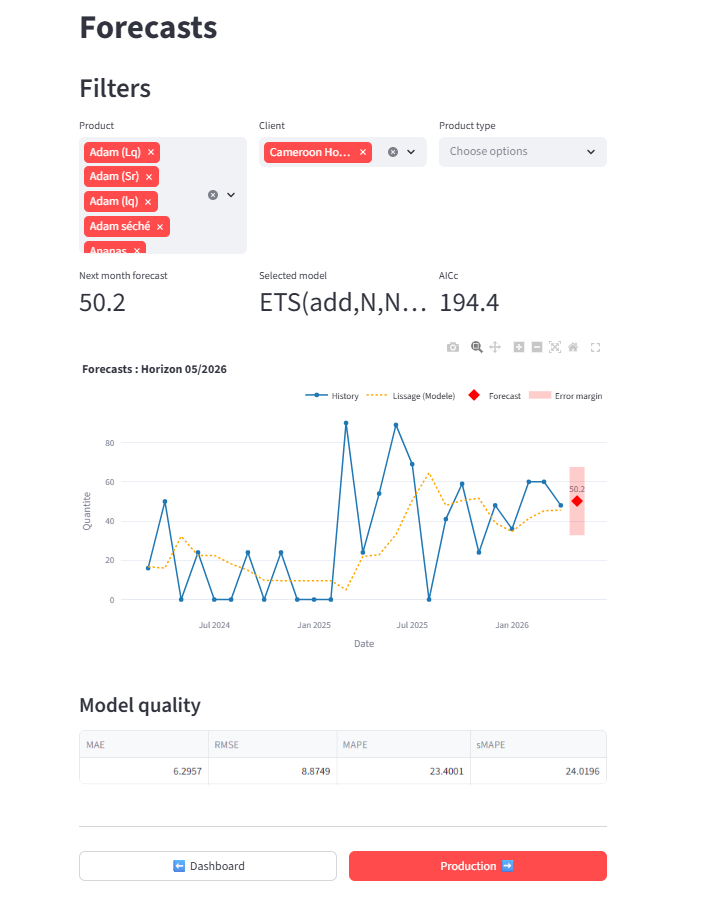
Actionable forecasts
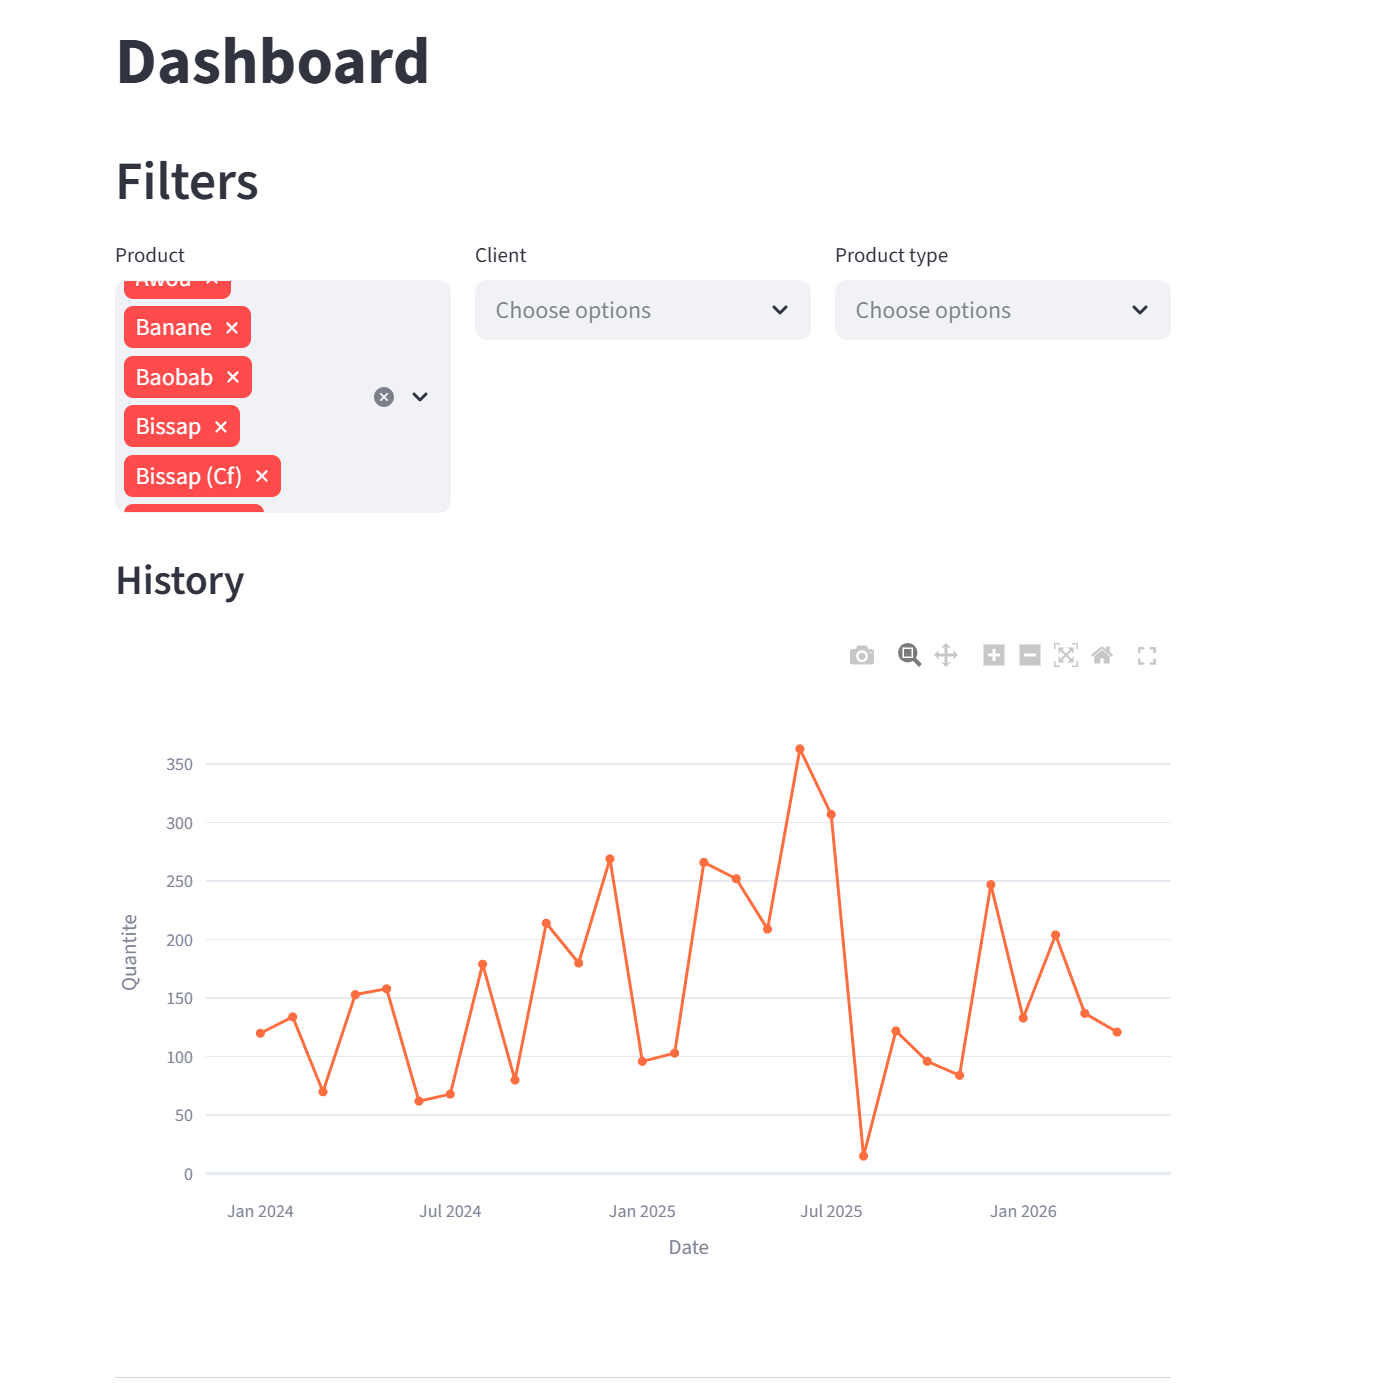
Historical sales are converted into a readable monthly forecast, including a confidence interval and a direction-friendly presentation.
Direct production plan
Forecast demand becomes a net manufacturing requirement ready to be distributed across the month.
Shareable report
A professional PDF summarises the results, allocation logic, and the weekly plan.
Why this tool exists
In many food SMEs, demand planning is still split across Excel files, WhatsApp messages, incomplete stock sheets, and manual decisions. The result is shortages, overstock, unclear trade-offs, and a lot of administrative time.
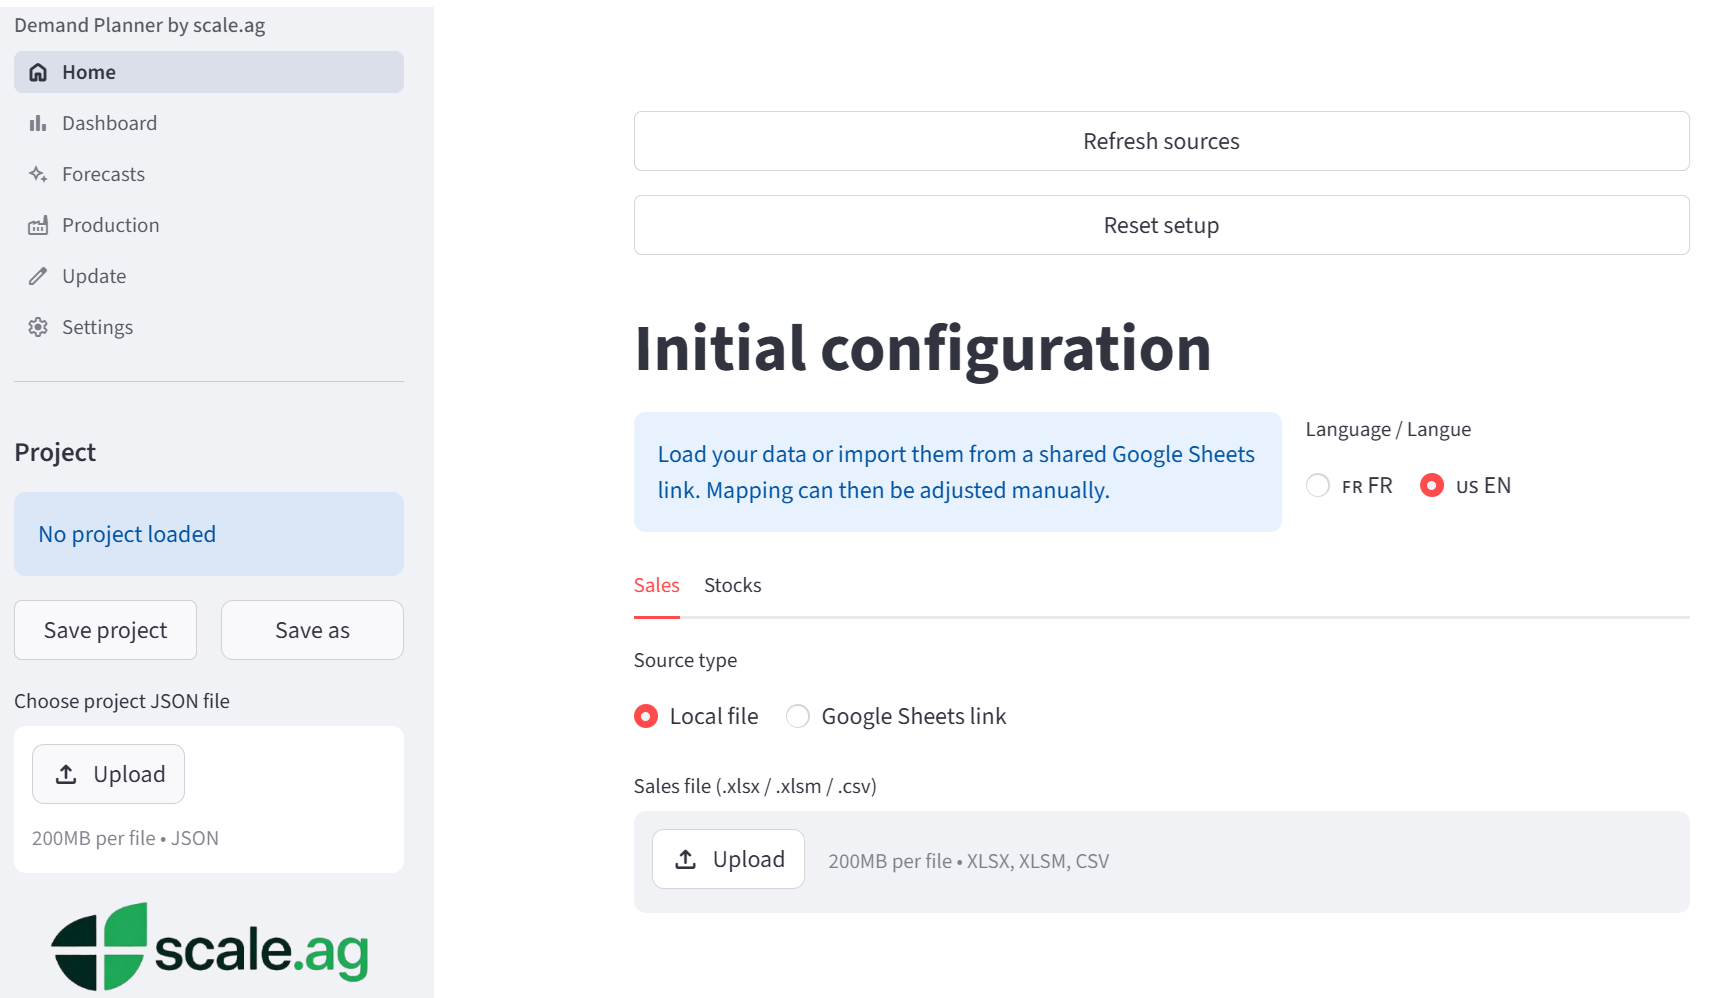
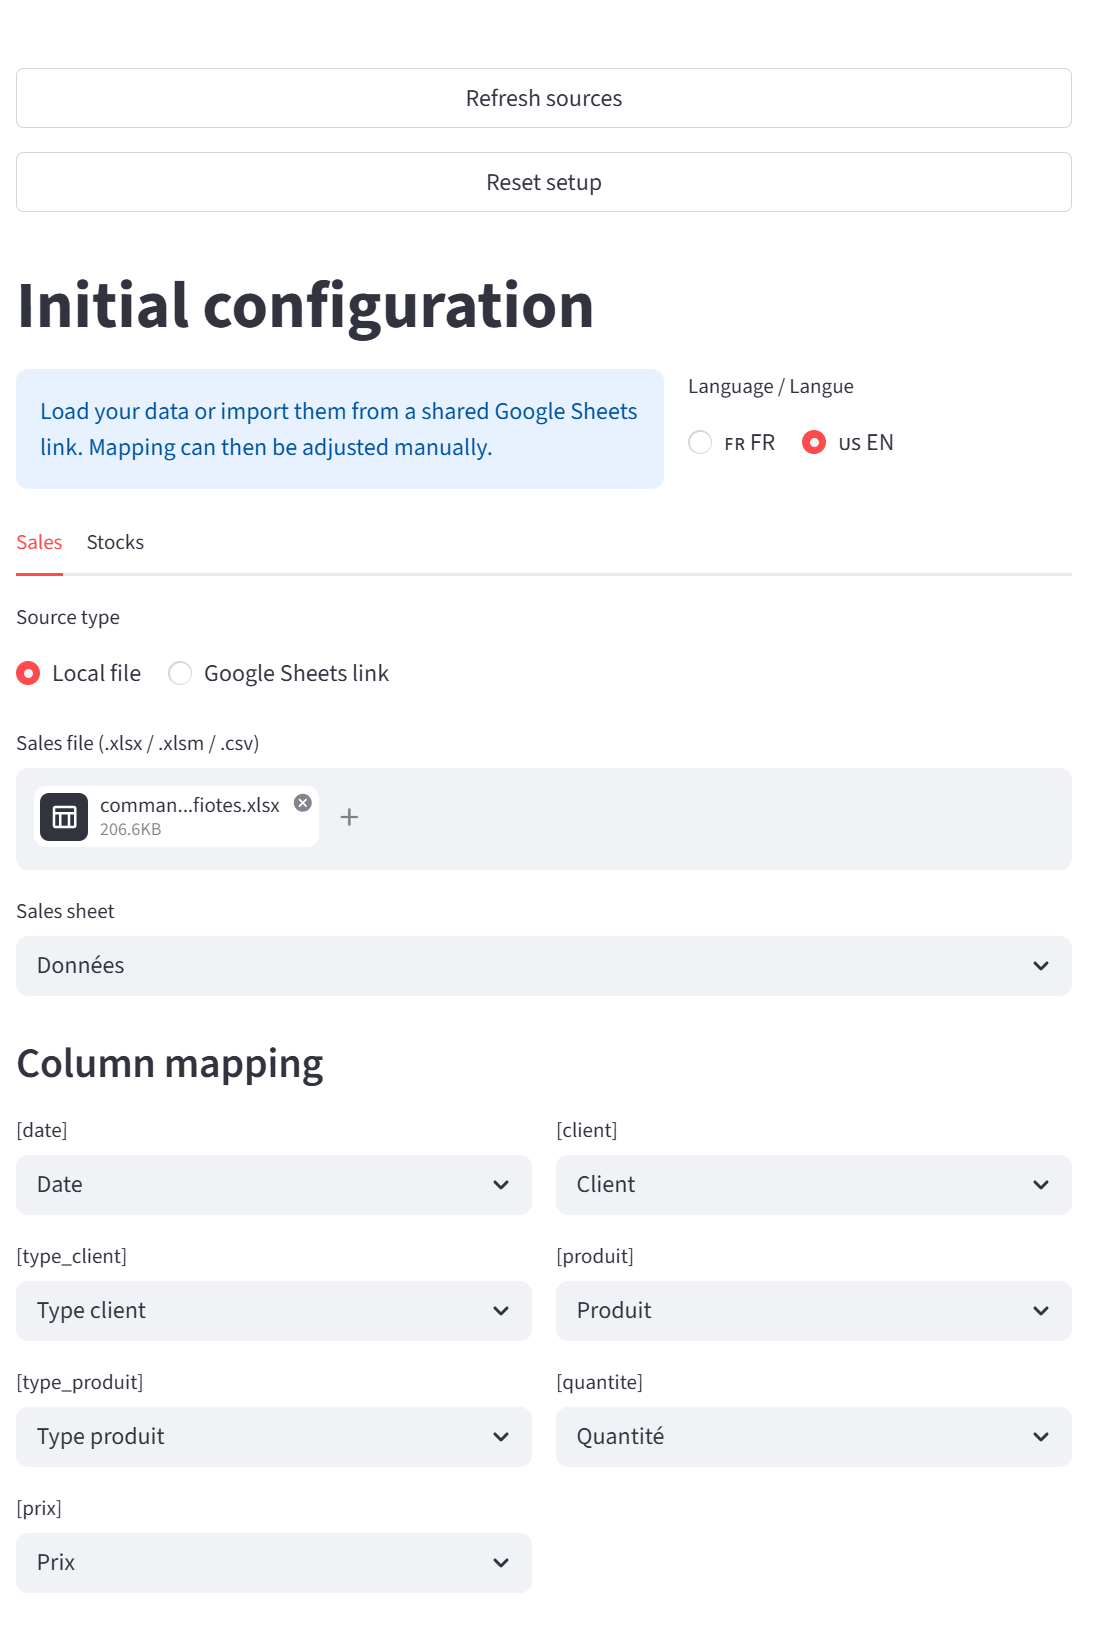
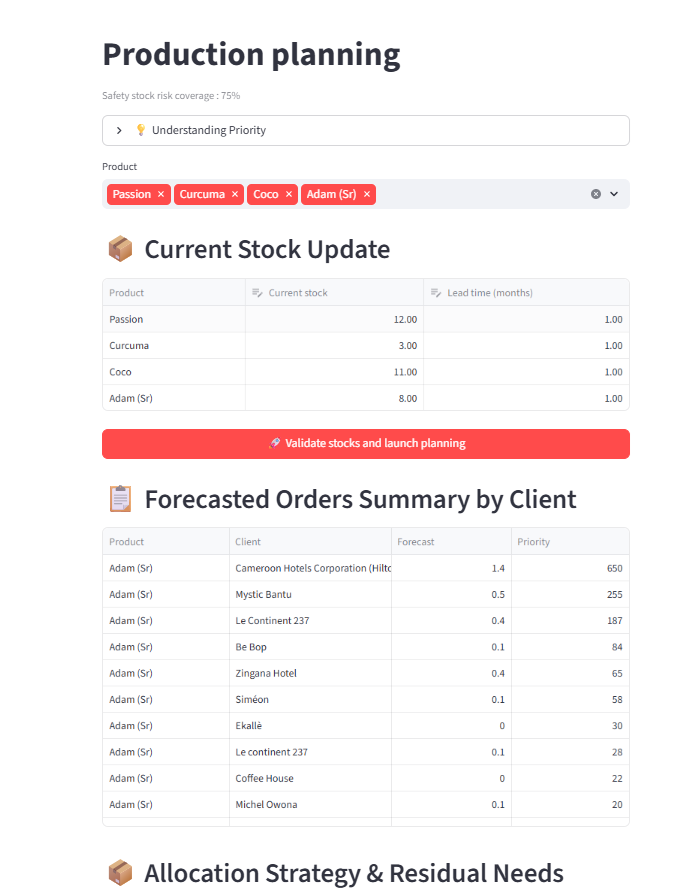
Demand Planner was built to bring the whole process into a single, readable, repeatable workflow. The user uploads the data, checks the mapping, reviews the history, generates a forecast, and gets a concrete weekly production plan.
How it works — 6-step workflow
The carousel below follows the main application screens, from data import to final export.
Key features
🔎 Flexible import
Support for Excel, CSV and Google Sheets. The goal is to minimise friction and accept real-world data constraints.
🧠 Statistical forecasting
The engine compares multiple time-series models and retains the one that best explains the sales structure.
📦 Prioritised allocation
Available stock is assigned to clients according to business priority: historical volume and order urgency.
🗓️ Weekly planning
The monthly need is redistributed across weeks to support operational execution.
🔐 Local-first
Data stays on the user’s machine, with optional Google Sheets input when needed.
🧾 PDF export
The final report can be shared directly with production, management or external partners.
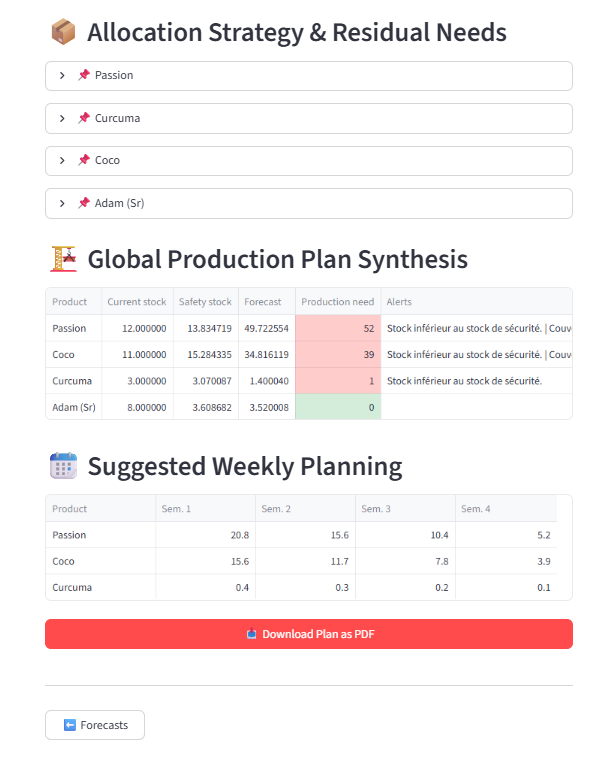
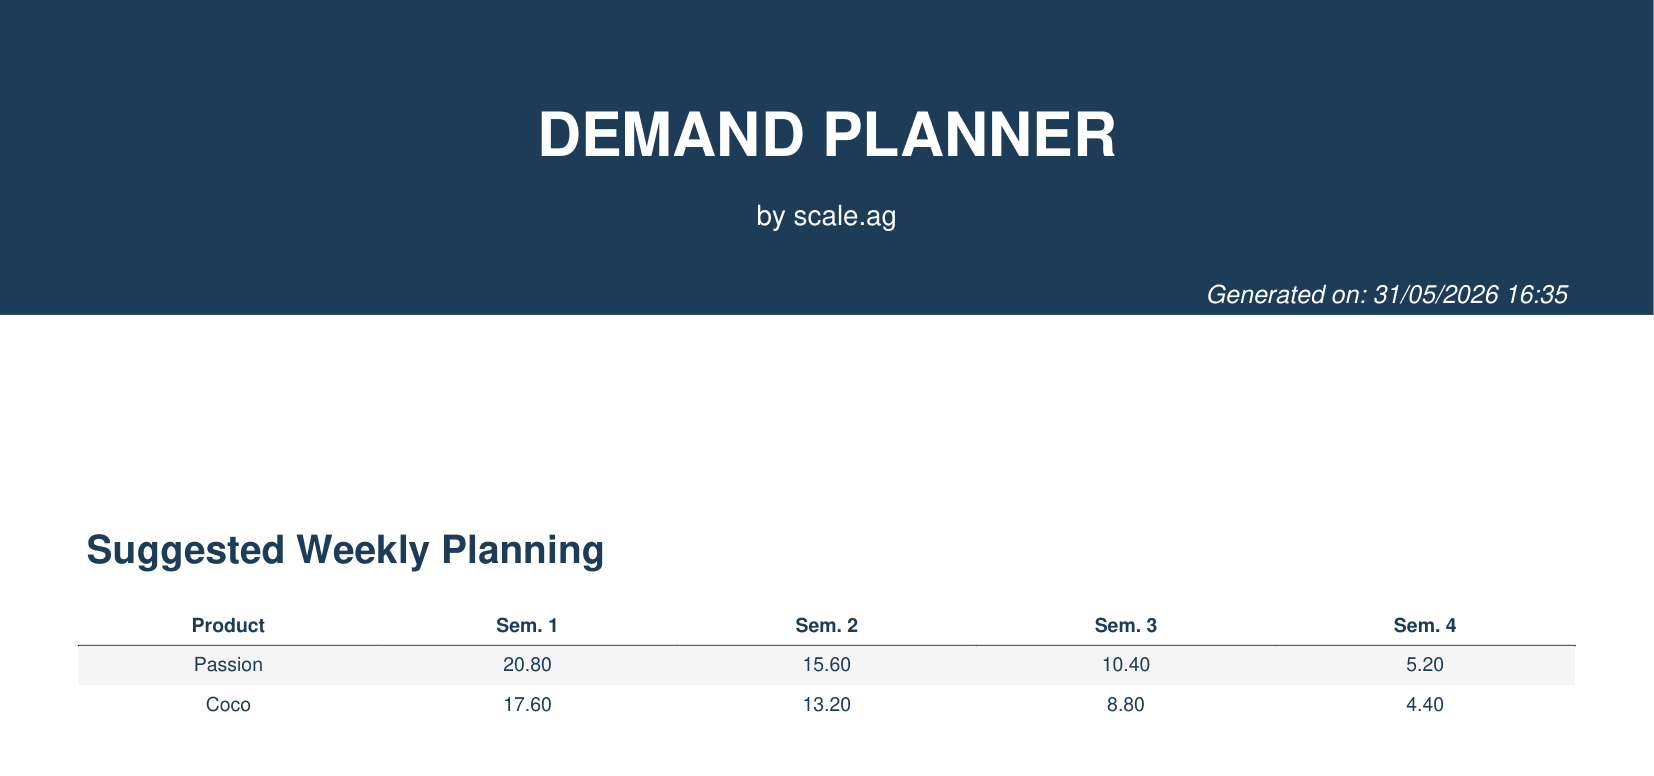
Example of a generated production plan
Below is a carousel preview of a 6-page PDF report as generated after planning is validated.
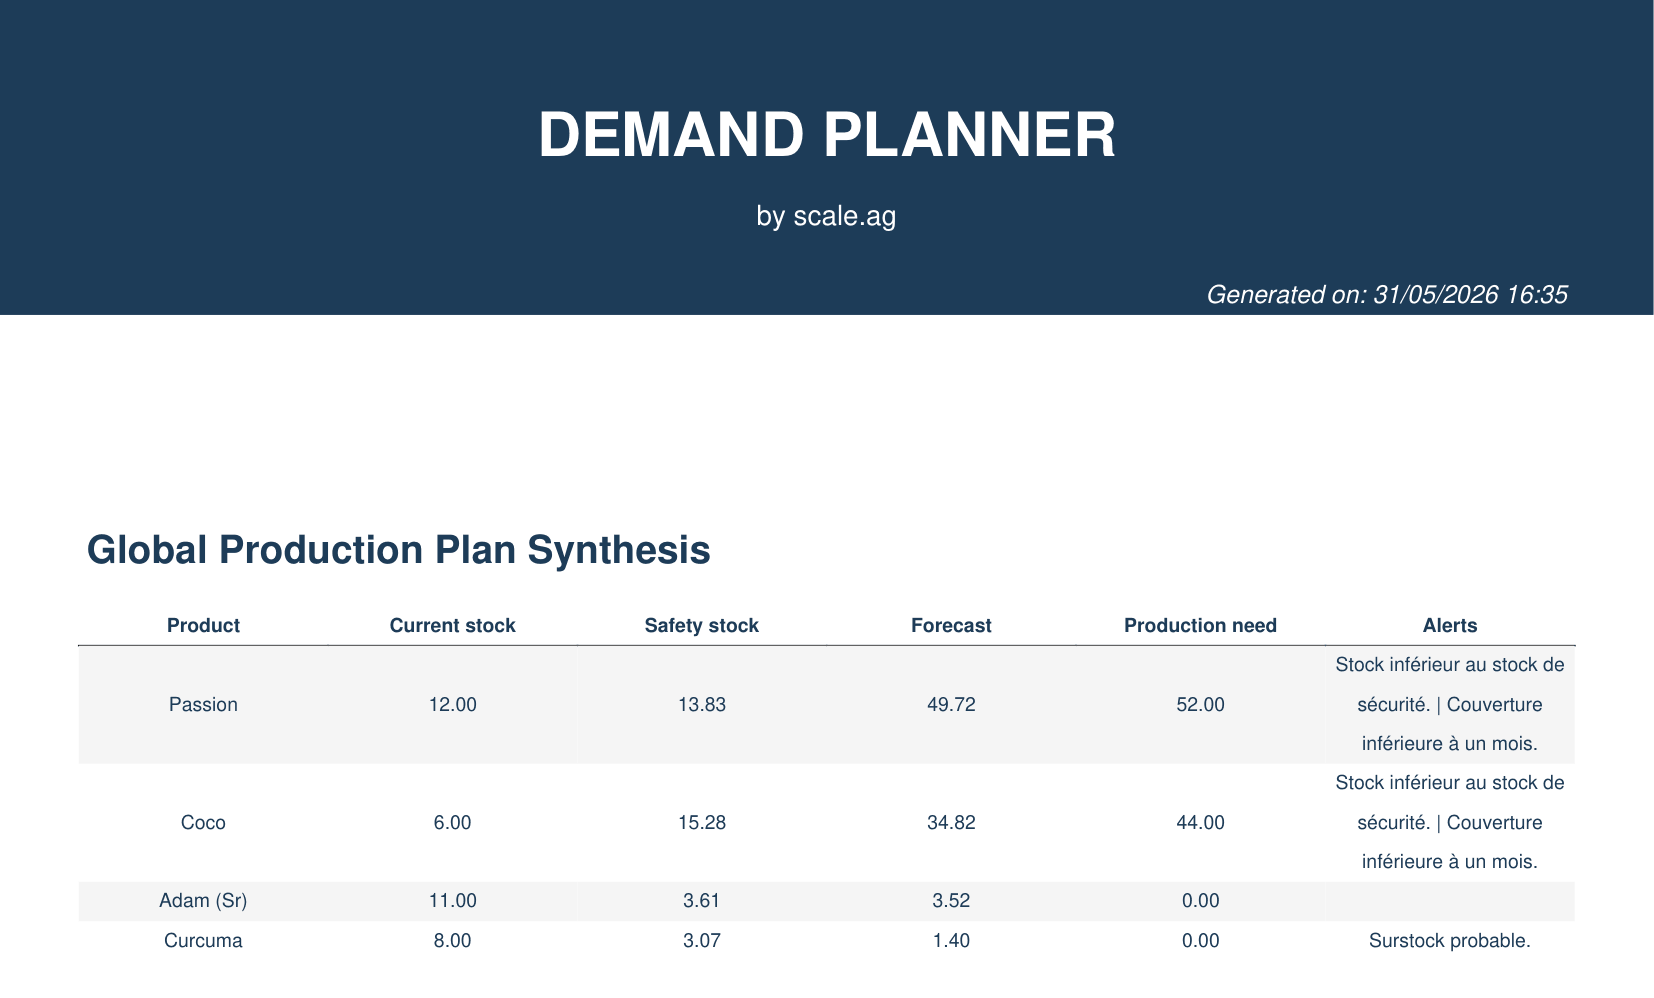
What the production plan shows
1. Net requirements
The quantities to produce are computed after considering available stock and prioritised allocation.
2. Time distribution
The monthly need is spread across several weeks to fit production capacity and lead times.
3. Executive reading
The PDF is designed to be reviewed quickly by management, production teams or external stakeholders.
Technology & method
- Streamlit for the interactive interface
- Pandas for data preparation and aggregation
- Statistical forecasting for demand estimation
- Business-priority client allocation logic
- PDF export for operational reporting
- Local-first mode for data sovereignty
This project can serve as a commercial demo, an internal planning tool or the foundation for a more integrated version.
Security and governance
Demand Planner naturally fits internal use: data can remain local, sessions can be saved as JSON projects, and results can be shared selectively as PDFs.